
⚡ Project Flow Metrics
Track the Flow. Fix the Bottlenecks. Build Momentum That Lasts.
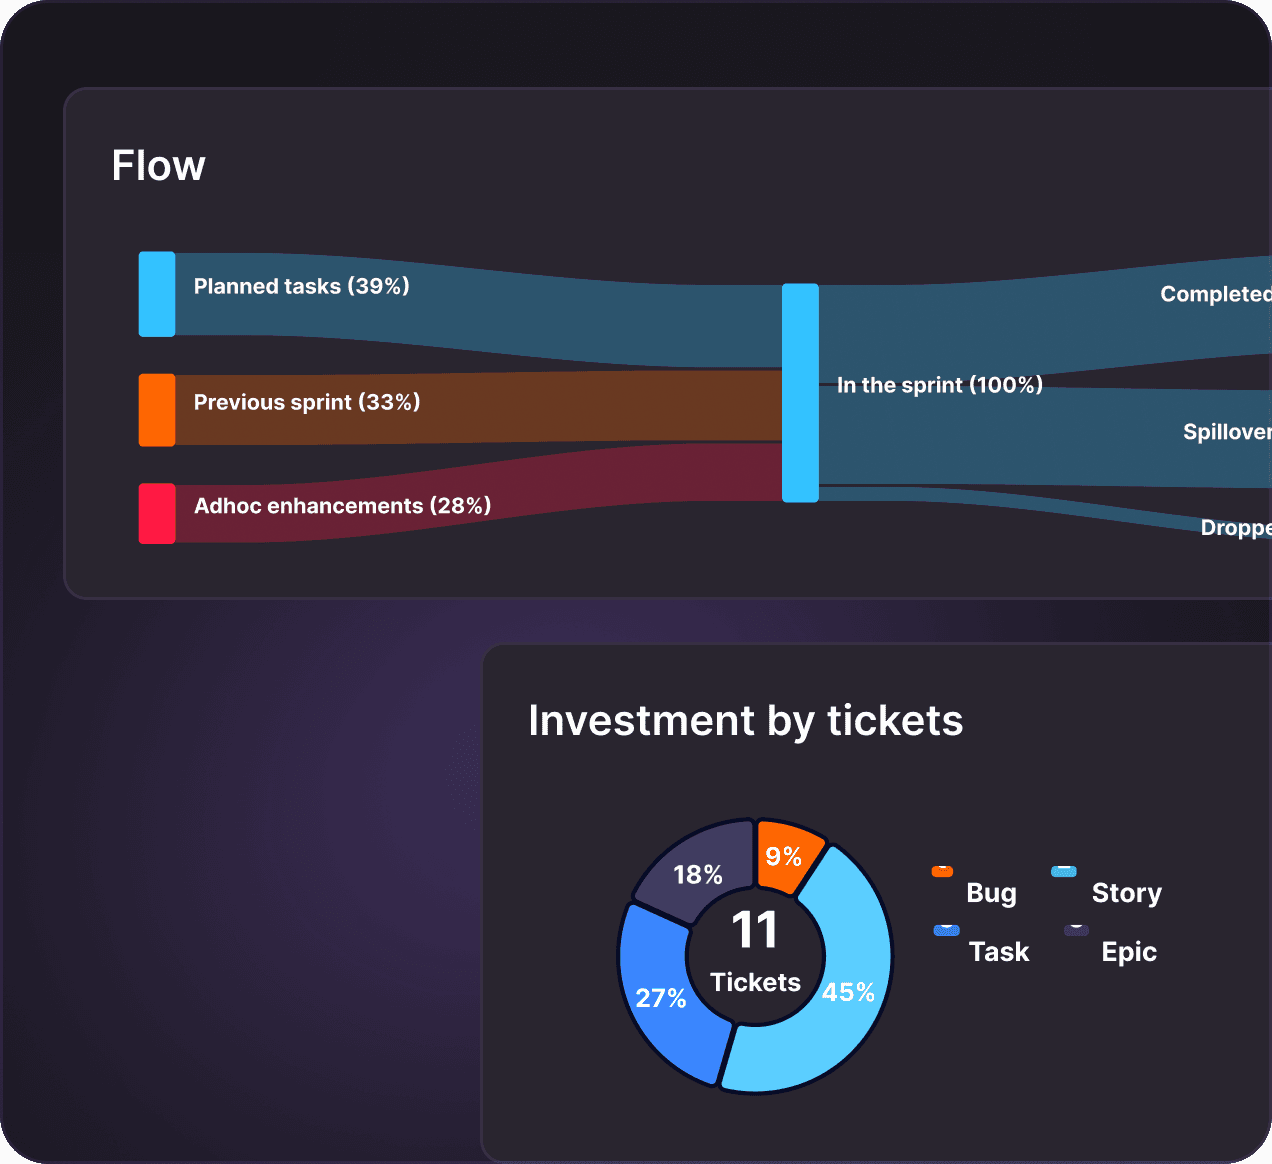
Use powerful visual flow insights to understand what's planned, spilled or dropped. Bring order to your engineering pipeline and align your team with precision.


You Deserve a Clear View of Delivery
Hundreds of teams felt the same confusion before finding clarity with Middleware. Let’s walk you through it.
⚡ Problems We're Solving
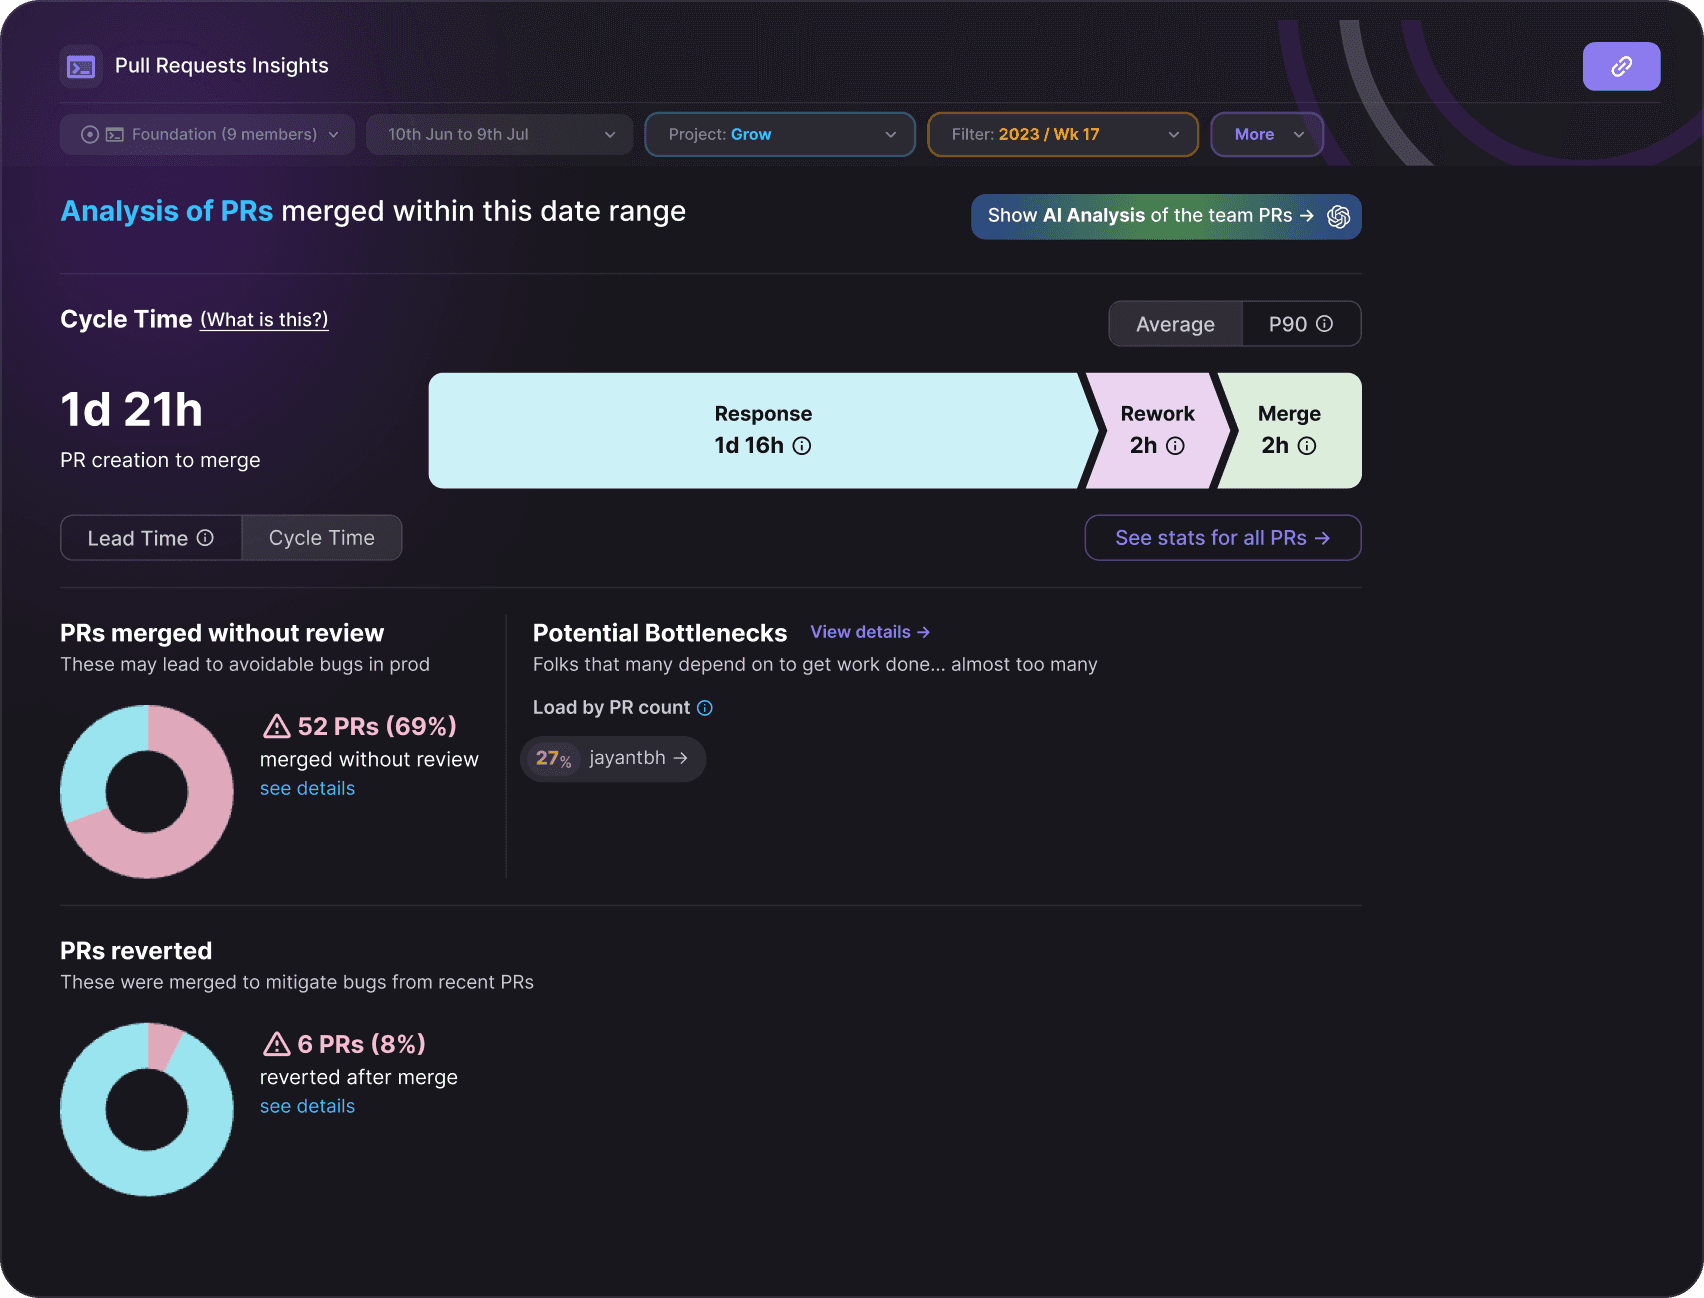
Too many tools, not enough clarity?
What’s Causing Spillage, Dropouts, or Burnout?
Most teams can’t explain what went wrong until it’s too late. Middleware uncovers root causes hidden in your flow — so you fix the real problems, not just the symptoms.
Break Down Planned vs Unplanned Effort
Visualize Time Across Tickets
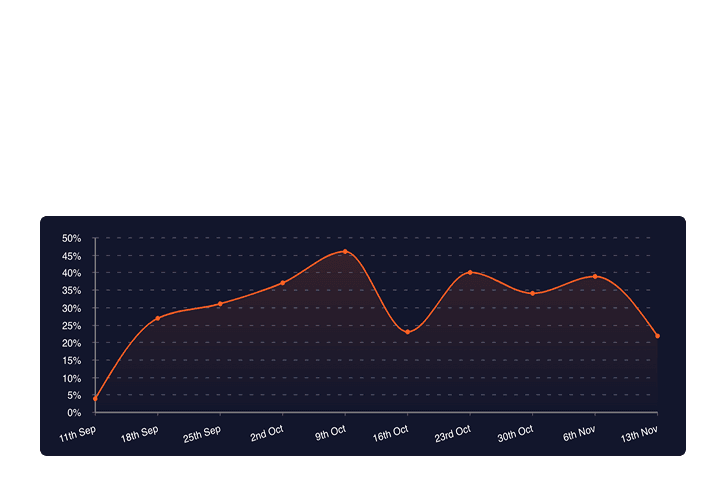
Ticket Investment Trends Across Sprints
Why Are 14.6% of Tasks Slipping? Now You’ll Know.
You plan every sprint with care — but work keeps spilling over. You need more than a burndown chart.
Track spillover trends across teams and sprints, so you can address estimation gaps, focus effort, and build sprints that hold and delivery better software on time.
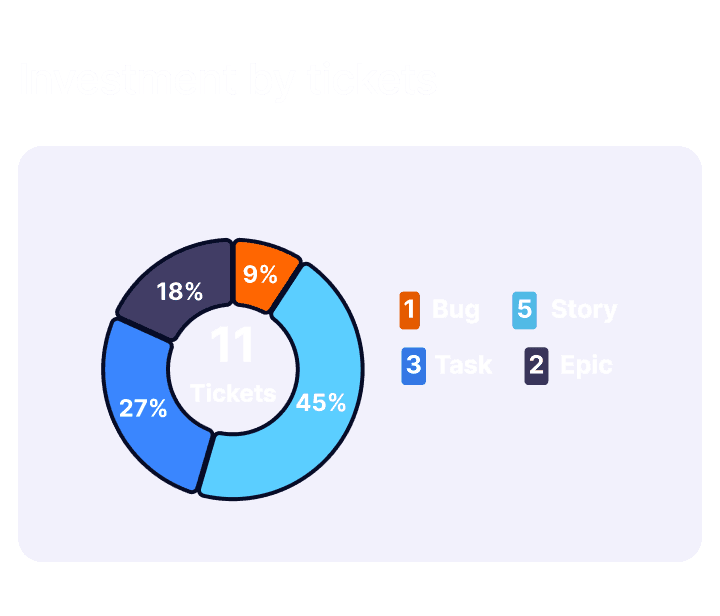
See Exactly What's Eating Your Sprint
It feels like you’re planning the right work… but the output never matches.
With Middleware, see how your team’s time is actually split between stories, bugs, tech debt, and ad-hoc work. Identify the mismatch. Fix it fast.
Ready to Stop Reacting?
Software delivery is messy. Your dashboard shouldn’t be.
Spin up Middleware in under 3 minutes and get instant clarity across projects, teams, and trends — all in one place.
🤔 Frequently Asked Questions